
M-STEP History Report
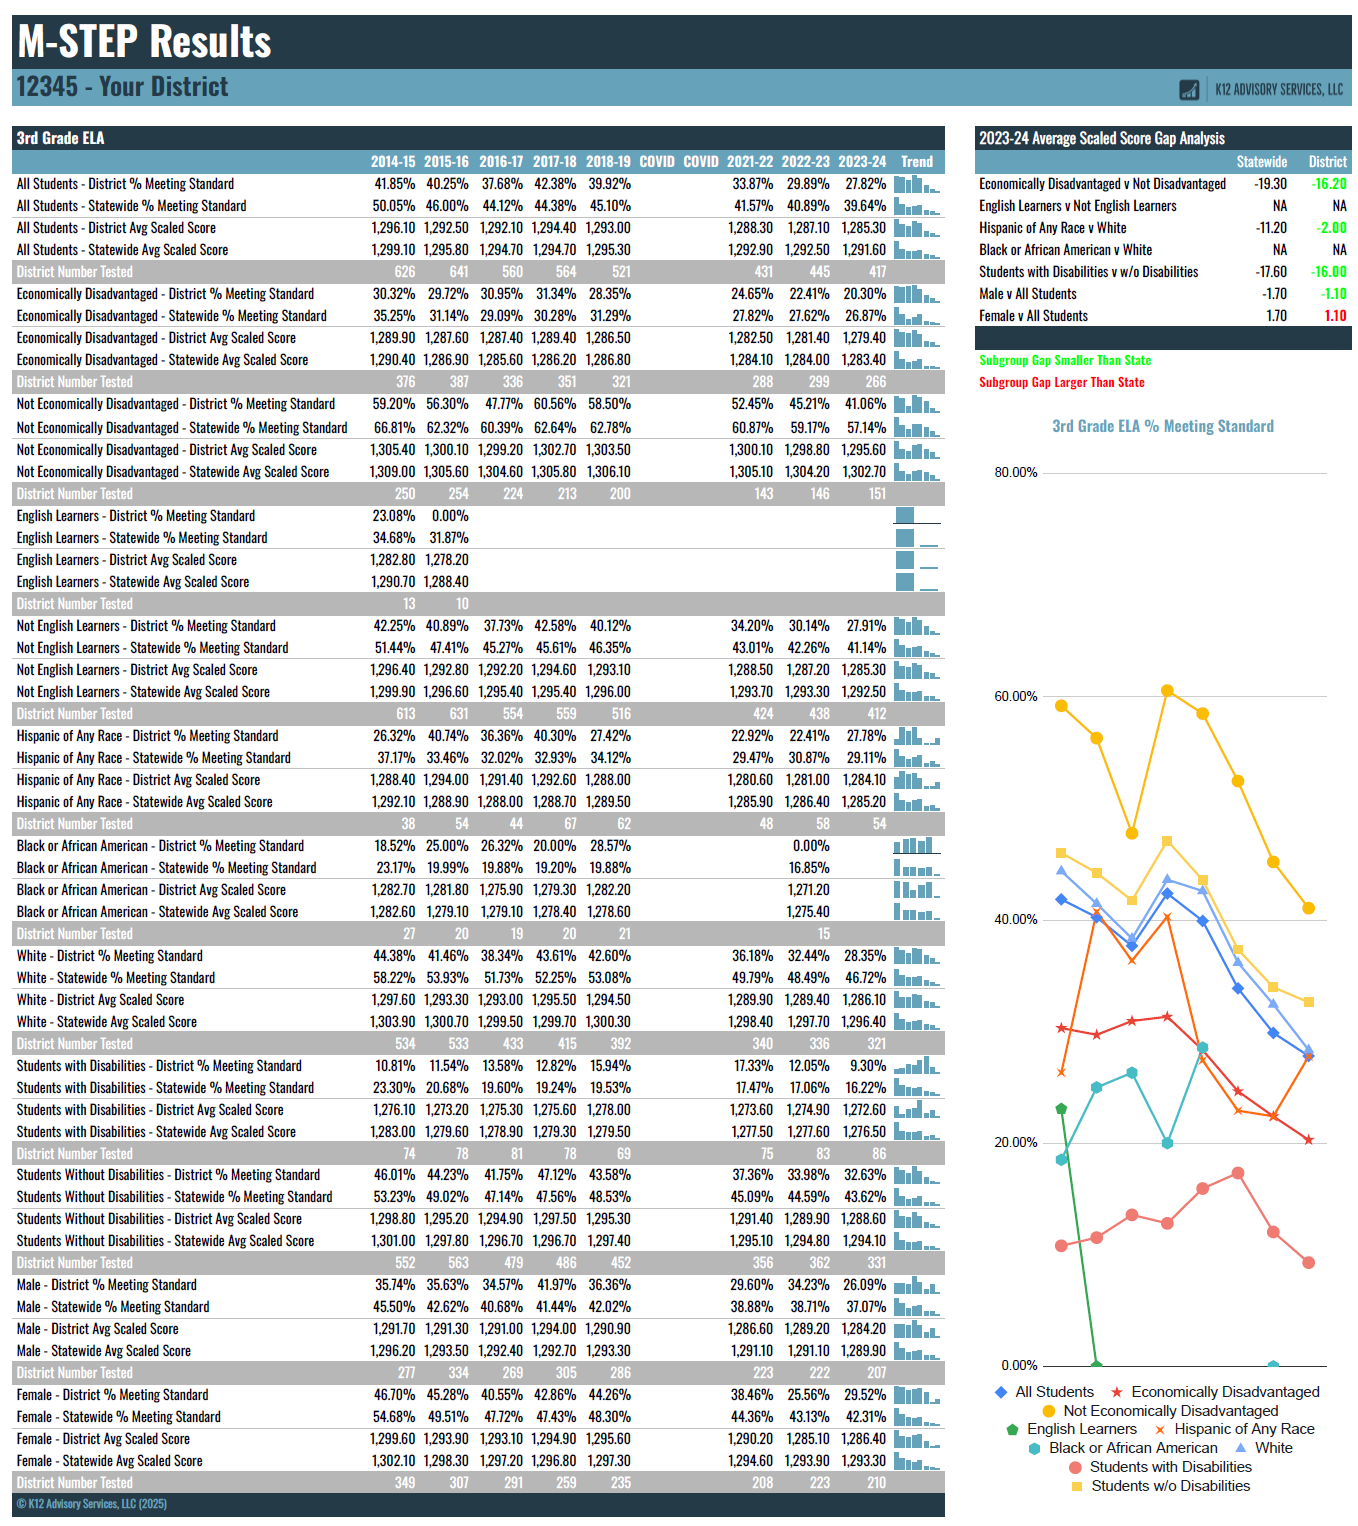
Get a full ten years of history for your district M-STEP results, broken down by grade level, content, and subgroup. See both the percent of students meeting standard as well as average scaled scores for each content and subgroup. All of your results are compared to statewide results.
In addition, we provide a quick visual analysis of select subgroup gaps, showing you instantly how your subgroups are performing relative to statewide results. You will see the statewide gap in scaled scores for various subgroups side-by-side with the subgroup gaps for your district. A simple green/red result will show you when your subgroup gaps are smaller (green) or larger (red) than the statewide results.
Finally, the report includes a graph of the percentage of students meeting standard over time, for various subgroups and all students.
These reports can save hours compared to running reports from public databases and compiling data for use in your required annual reports or your internal reporting processes.